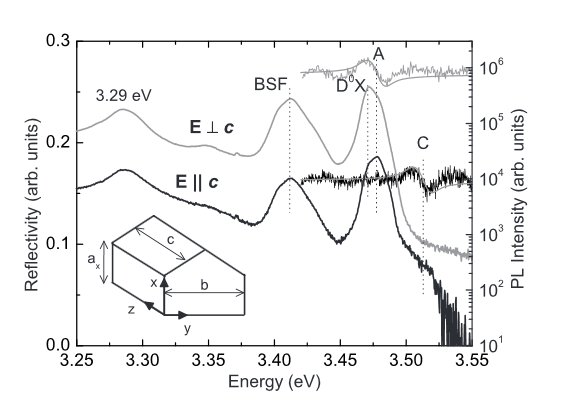
1) Reflectivity and photoluminescence spectra of non-polar GaN in orientation (11-20)
Reflectivity spectra (in linear scale) and photoluminescence (in log scale) of non-polar GaN in orientation (11-20). The light is polarized either perpendicular to the axis c or parallel. The confrontation of the reflectivity and luminescence data allows to identify free excitons.
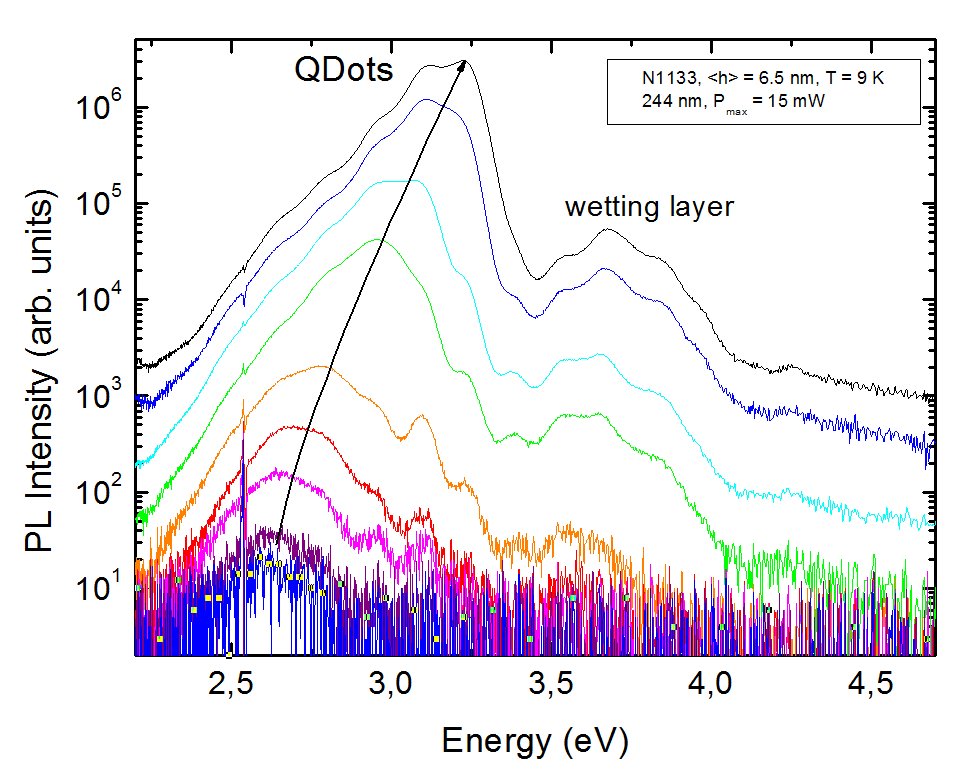
2) 9K photoluminescence spectra of polar quantum dots Al0.5Ga0.5N/GaN
9K photoluminescence spectra of polar quantum dots Al0.5Ga0.5N/GaN for excitation intensity varying over 4 decades. The gradual removal of the Stark effect is translated by a blue shift of 600 meV.
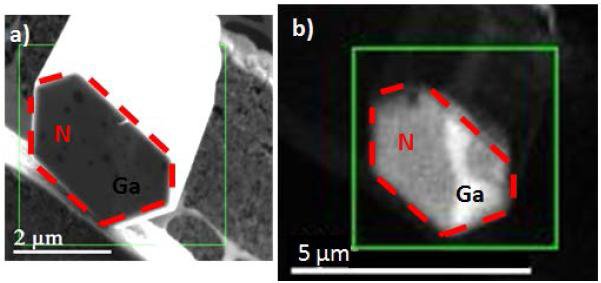
3) GaN microwires with nitrogen polarity inversions / gallium
Data obtained on GaN microfils with inversions nitrogen / gallium polarity; (a) SEM image; (b) CL image in mode panchromatic at 300K; (c and d) hyperspectral mapping on the microfilm, focused on the maximum intensity of the transition band edge at 3.4eV for (c) and for the maximum intensity of the yellow band at 2.2eV for (d).
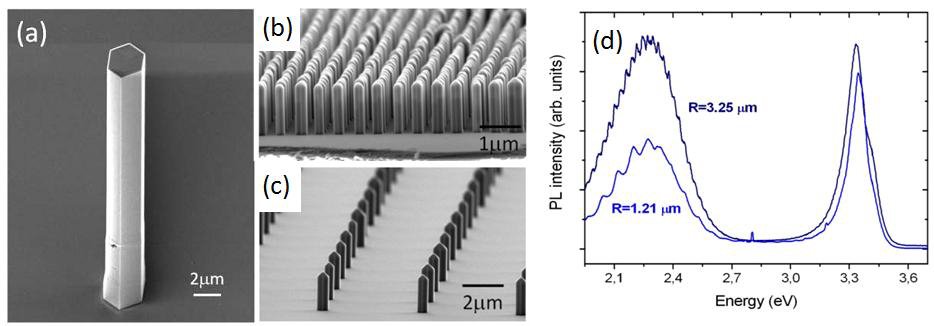
4) Micro-photoluminescence spectra and SEM images of microfilaments GaN
(a-c) SEM images of GaN microfilts; (b) recorded µPL spectra at 300K on two microfilms with different diameters, highlight gallery modes.
The devices used are described in the page characterization of CRHEA.